The Netherlands’ Residential Property Market Analysis 2026
The Dutch housing market has turned. Two ECB rate hikes since June, rising mortgage rates, and stretched affordability have pushed annual house price growth down to 3.9%, barely above inflation, while sales growth has faded and Amsterdam prices have stalled. Structural scarcity still prevents outright falls, but the price rally that defined 2024 and 2025 is over.
This extended overview from Global Property Guide covers key aspects of the Dutch housing market and takes a closer look at its most recent developments and long-term trends.
Table of Contents
- Property Prices and Price Index
- Historic Perspective
- Property Demand Trends
- Property Supply Trends
- Rental Market: Rents and Rental Yields
- Mortgage Market and Interest Rates
- Economic and Social Factors
Property Prices and Price Index
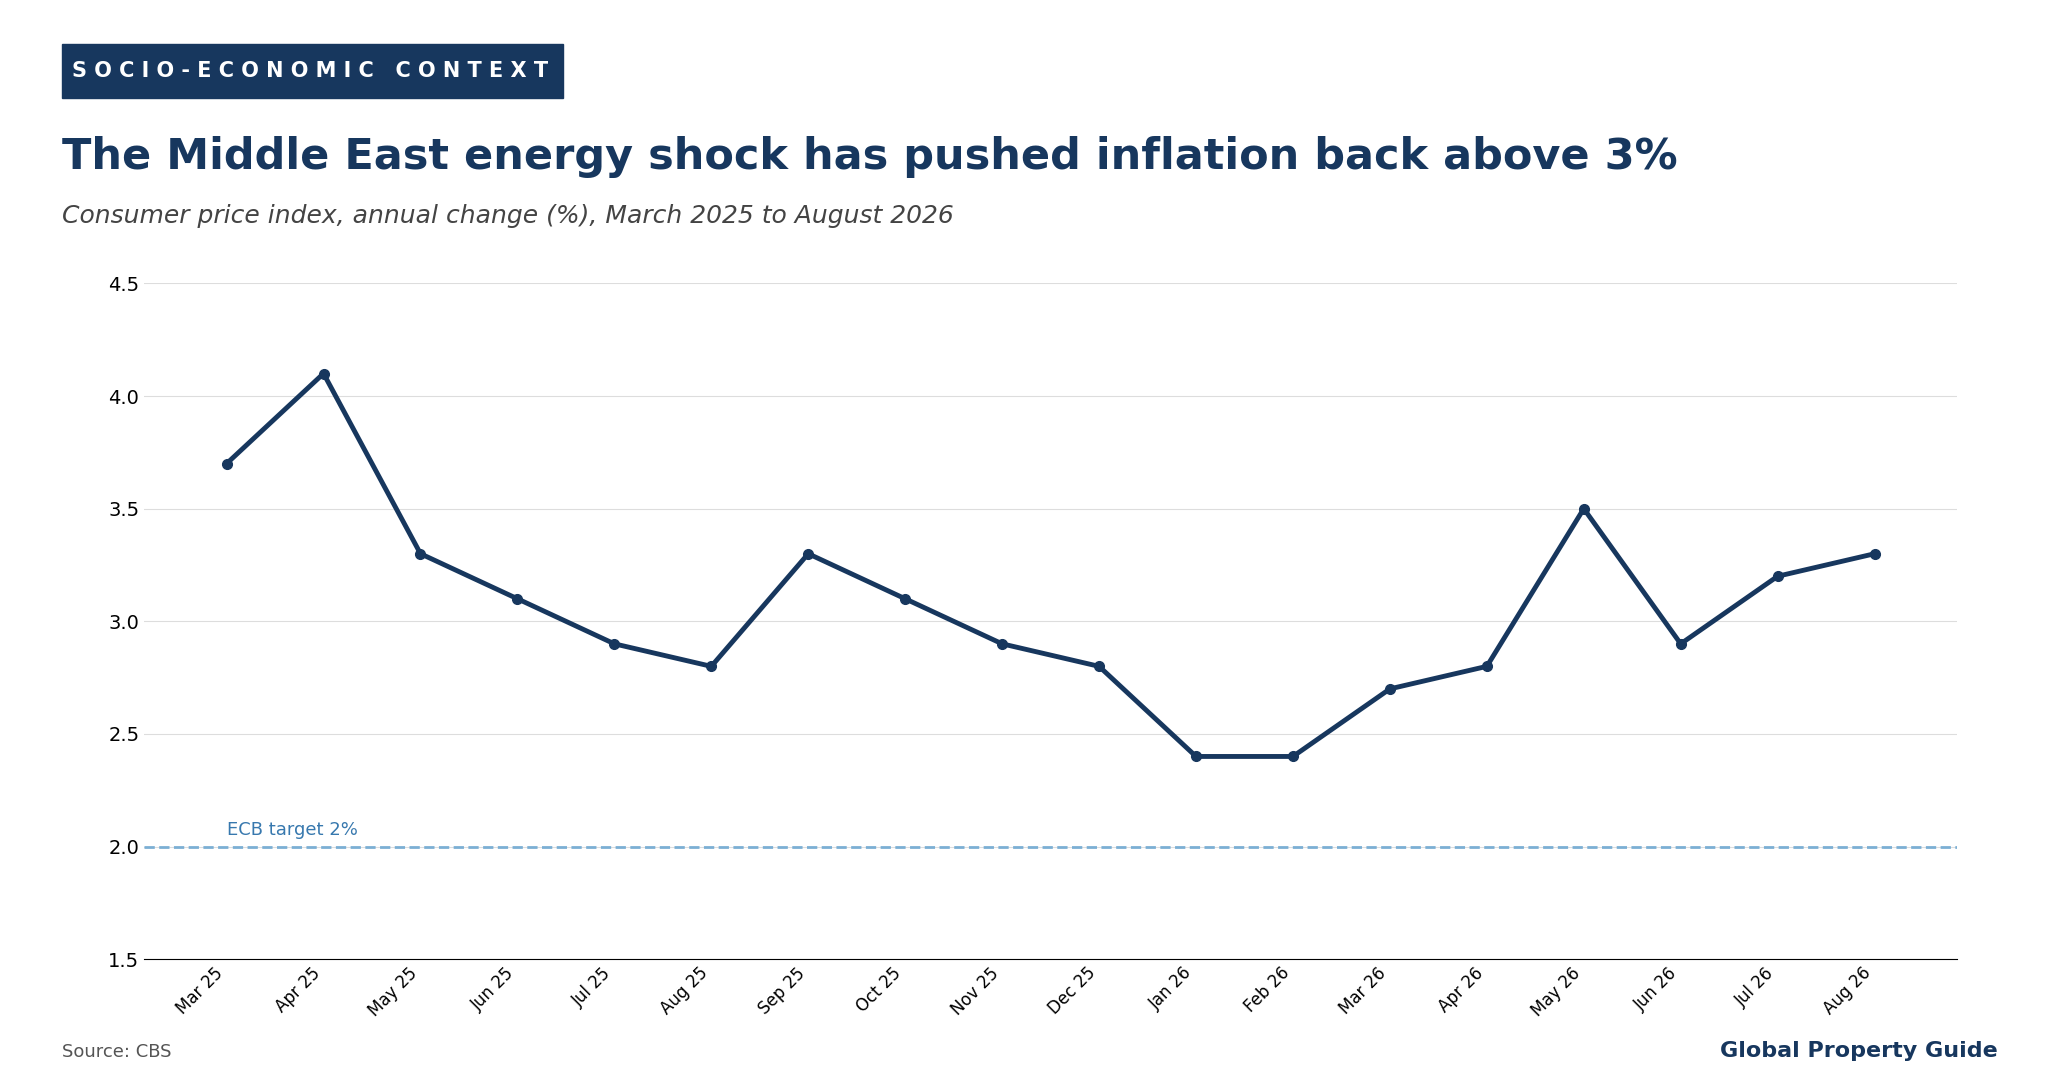
The outlook presented in our May edition, of prices temporarily dampened by investor sell-offs before re-accelerating in 2027, no longer holds. According to Statistics Netherlands (CBS) and the Land Registry (Kadaster), the price index for existing owner-occupied homes rose by 3.9% year-on-year in July 2026, down from 5.4% in January and a peak of 11.9% in November 2024. Annual growth has slowed almost every month since the end of 2024. With consumer price inflation at 3.2% in July, real house prices rose by only around 0.7%.
The Netherlands house price annual change:
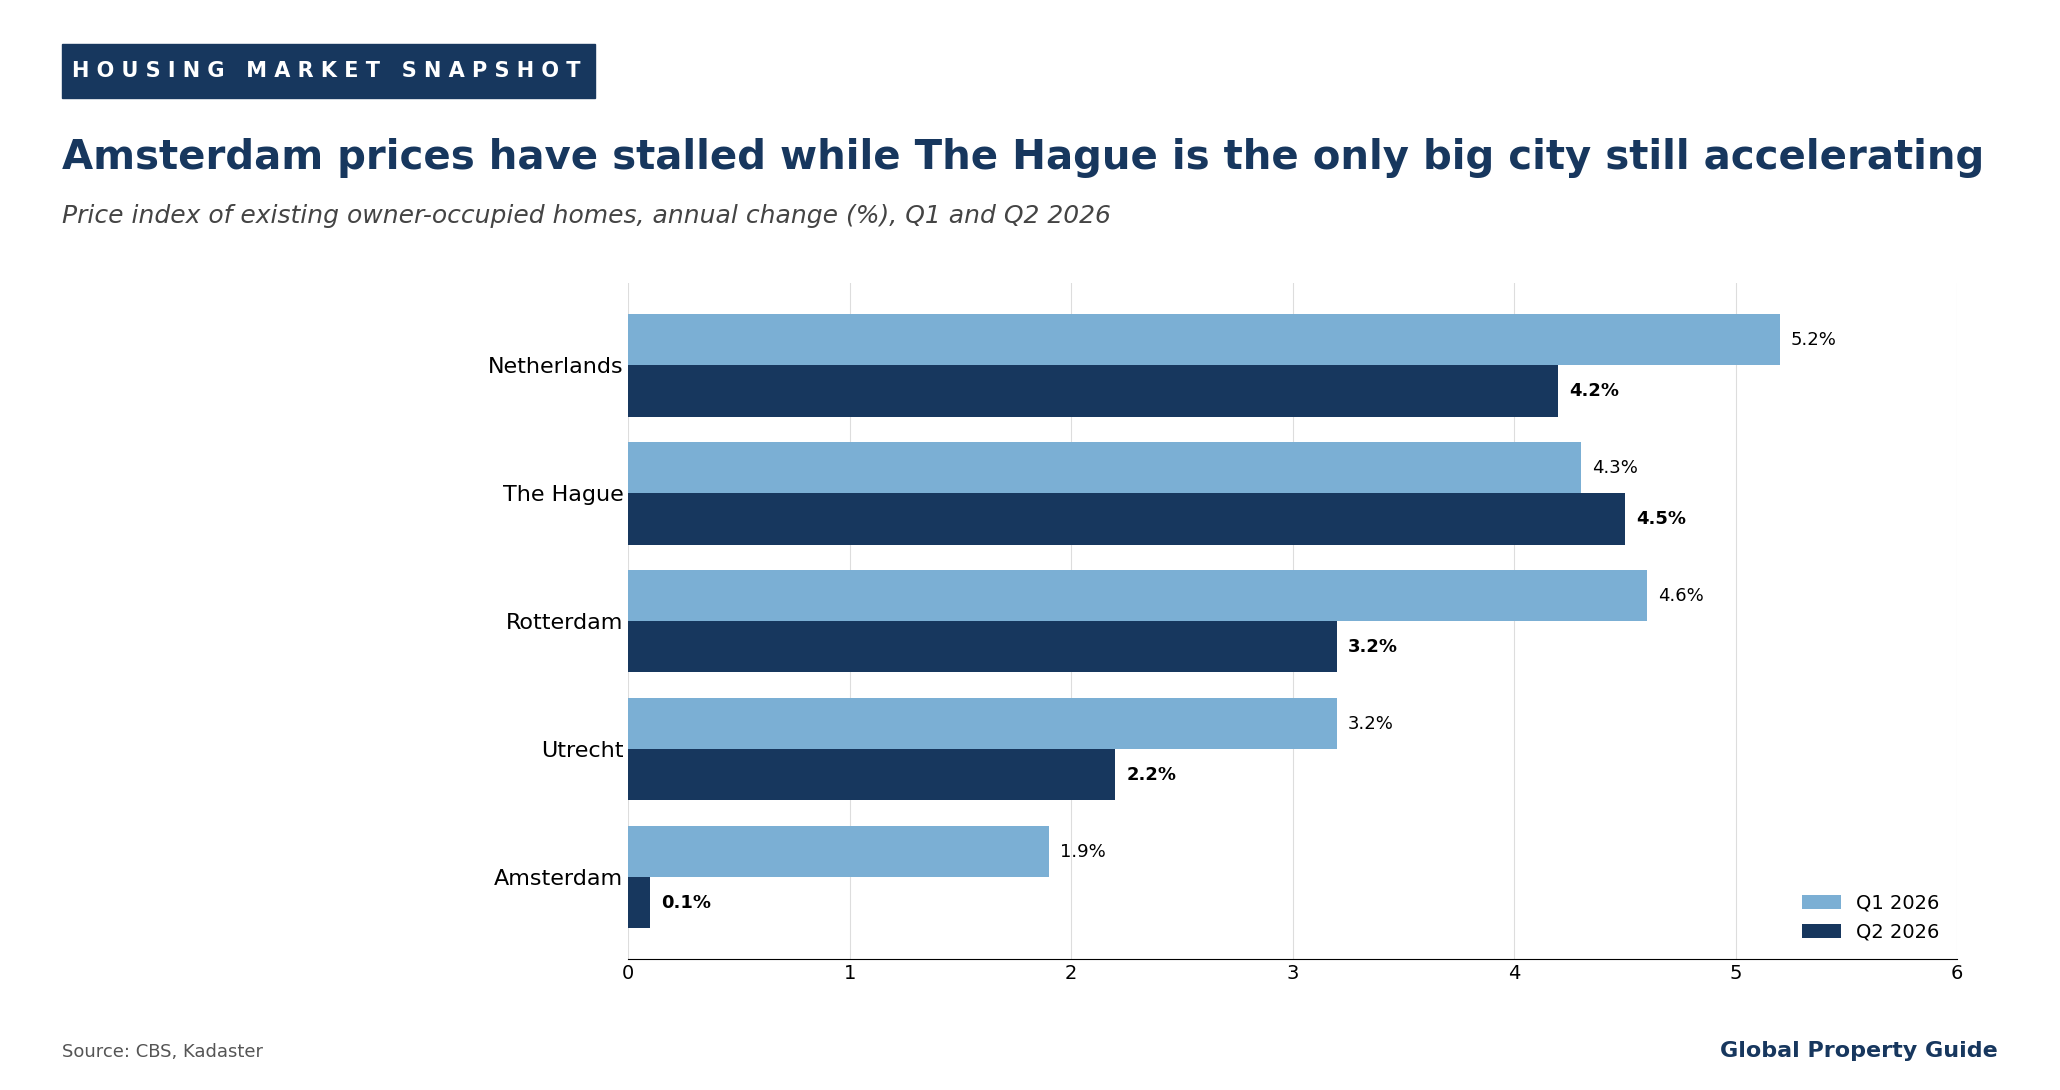
On a quarterly basis, the index was 4.2% higher in Q2 2026 than a year earlier, after 5.2% in Q1 2026 and 8.6% for 2025 as a whole.
Month-on-month, prices are still edging up: the index rose by 0.5% in July and is 3.4% above its December 2025 level, 17.9% above the previous peak of July 2022. However, CBS records prices at the notarial transfer, on average around three months after the purchase agreement is signed, so the published figures still reflect deals struck before the ECB's first hike in June. Rabobank notes that the effects of the Middle East conflict and higher mortgage rates are not yet visible in the official statistics, while real estate agents report more hesitant buyers and fewer viewings.
The national average transaction price for an existing owner-occupied home was EUR 500,988 (USD 582,599) in July 2026. Unlike the price index, this figure is not adjusted for differences in the quality of homes sold. All US dollar conversions in this article use a single rate of EUR 1 = USD 1.1629, the Q2 2026 average of the ECB's euro reference rates.
The slowdown is sharpest in the largest cities, where the sale of former rental homes by investors has added most supply. In Q2 2026, prices in Amsterdam were virtually unchanged year-on-year (+0.1%), and Utrecht rose by just 2.2%. The Hague was the only one of the four largest cities where price growth accelerated. Six municipalities recorded price declines in Q2, compared with just one in the previous quarter, while the strongest increases were in the north and east of the country, led by Oost Gelre (+20.9%).
Rabobank now expects existing homes to be 2.8% more expensive on average in 2026 and just 2.0% in 2027, with no further price rise during the rest of 2026; the 2026 figure is almost entirely a carry-over from gains made in 2025. In March, the bank still forecast 3.1% and 4.1%. It expects prices in the Amsterdam and Haarlem regions to rise by only around 1% in 2026, and the highest growth, around 6%, in East Groningen. The central bank, De Nederlandsche Bank (DNB), likewise projects a more moderate pace of house price growth in the coming years.
Correction note: in the May 2026 edition, the header of the city price table labelled Q1 2026 prices as Q1 2025, two figures (new lending and the outstanding mortgage stock) were converted to US dollars at undeclared exchange rates of around 1.13 rather than the declared EUR 1 = USD 1.1703, and the annual CPI rates quoted in the text (3.2% for 2024, 3.0% for 2025) did not match the CPI deflator used in the inflation-adjusted price table (around 3.35% and 3.26%). This edition applies a single declared rate throughout.
Historic Perspective
Boom, Correction and a New Turn
Following a prolonged downturn in the aftermath of the global financial crisis, the Dutch housing market entered an extended phase of robust price growth. After reaching a low in mid-2013, house prices began a steady upward trajectory, culminating in a peak annual increase of 20.21% (13.72% in real terms) in the price index for existing homes in December 2021.
This sustained appreciation was underpinned by historically low mortgage interest rates and favorable financing conditions, including high loan-to-value ratios and the widespread availability of interest-only mortgages. The tax framework further bolstered demand by offering strong incentives for homeownership. Demographic dynamics also played a significant role, with consistent growth in net migration and the emergence of smaller, more numerous households contributing to increased housing demand.
By late 2022, the pace of growth began to moderate. In 2023, the price index for existing homes posted a 2.91% annual decline, reflecting rising mortgage rates, geopolitical uncertainty, and a weakening economic outlook. The downturn proved short-lived: as inflation eased and mortgage rates fell, prices rose by 8.77% in 2024 and 8.57% in 2025.
In 2026, the cycle has turned again. The energy price shock from the Middle East conflict has revived inflation, the ECB has resumed tightening, and nominal price growth has slowed to roughly the rate of inflation. Unlike 2022-2023, however, a large wave of former rental homes has entered the owner-occupied market at the same time, softening prices most in the big cities.
20-year annual house price change (based on annual price index for existing homes and consumer price index):
| Year | Nominal house prices (%) | Inflation-adjusted house prices (%) | Year | Nominal house prices (%) | Inflation-adjusted house prices (%) |
| 2006 | 4.55% | 3.41% | 2016 | 5.47% | 5.13% |
| 2007 | 4.35% | 2.69% | 2017 | 8.19% | 6.71% |
| 2008 | 3.16% | 0.65% | 2018 | 9.21% | 7.38% |
| 2009 | -3.18% | -4.32% | 2019 | 7.04% | 4.30% |
| 2010 | -2.02% | -3.26% | 2020 | 7.87% | 6.52% |
| 2011 | -2.32% | -4.56% | 2021 | 15.10% | 12.10% |
| 2012 | -6.21% | -8.46% | 2022 | 13.29% | 2.99% |
| 2013 | -6.34% | -8.63% | 2023 | -2.91% | -6.50% |
| 2014 | 1.20% | 0.22% | 2024 | 8.77% | 5.24% |
| 2015 | 3.27% | 2.65% | 2025 | 8.57% | 5.14% |
| Data Sources: CBS, OECD, Global Property Guide. | |||||
Property Demand Trends
Transactions Slow
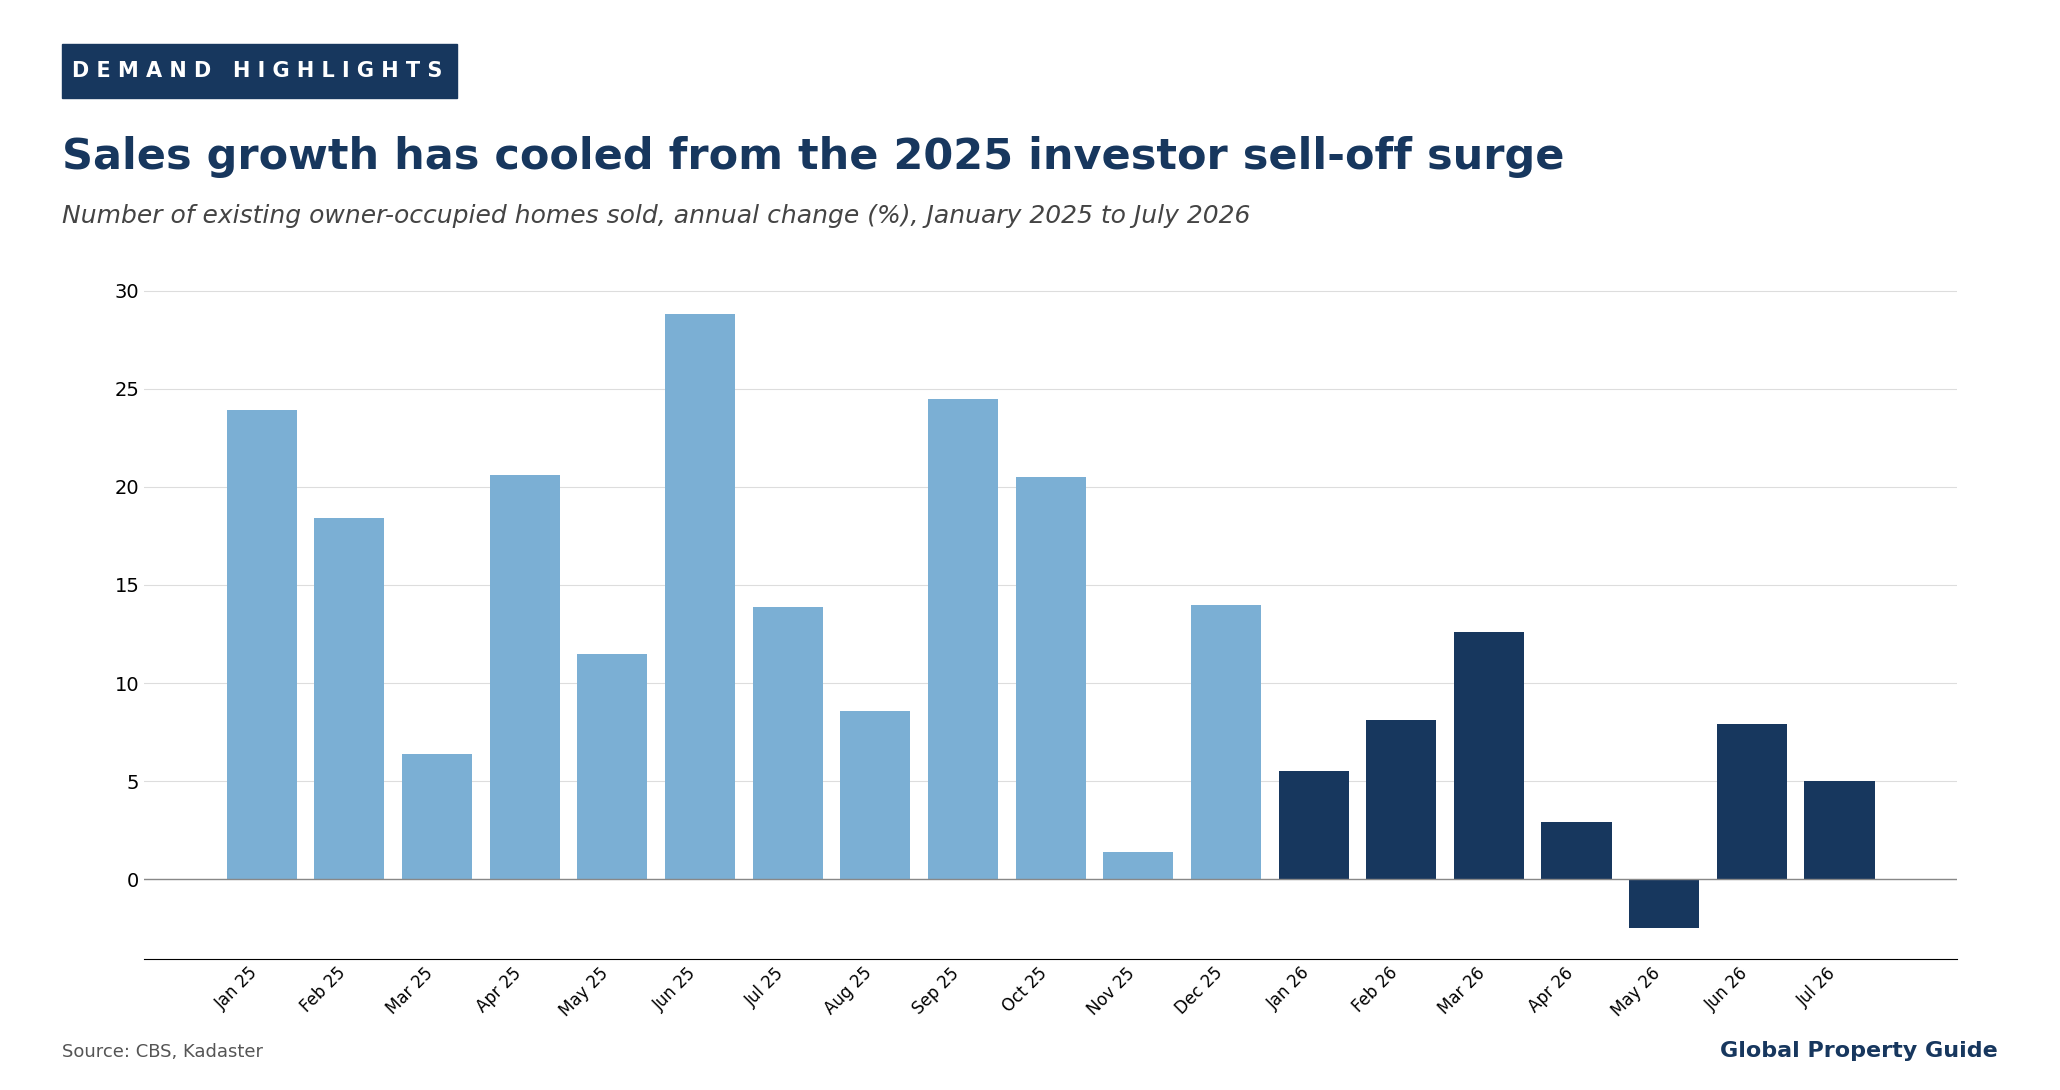
The surge in sales driven by landlords exiting the market is running out of steam. According to Kadaster, around 77,000 homes of all types changed hands in Q2 2026, 4% more than a year earlier, compared with an 18% increase in Q1. First-time buyers bought just 1% more homes than a year earlier, down from 9% growth in Q1, partly because investors are selling fewer of the cheaper former rental homes that starters favour.
Monthly CBS data show the same loss of momentum. In July 2026, 22,241 existing homes were sold, up 5.0% year-on-year, and May recorded the first annual decline (-2.5%) since June 2024. Over the first seven months of 2026, 137,142 homes were sold, 5.4% more than a year earlier.
The Sell-Off Has Peaked
Investors still own fewer homes each quarter: on 1 July 2026 they held 745,400 dwellings, or 8.9% of the housing stock, down from 9.2% a year earlier, with private investors accounting for most of the decline. But Rabobank estimates that landlords sold just under 39,000 former rental homes to owner-occupiers over the past four quarters, slightly fewer than in 2025, and that net sales fell for the first time since 2023. The bank concludes that most landlords who wanted to exit have already done so.
Meanwhile, supply for sale has climbed. The Monitor Koopwoningmarkt counted almost 85,800 homes for sale in Q2 2026, 26% more than in Q1 and 12% more than a year earlier, and NVM agents report a record number of new listings, noting a less overheated market with more choice for buyers.
Rabobank expects around 227,000 transactions in 2026, down from 239,000 in 2025, and a further fall to 200,000 in 2027 as the flow of former rental homes dries up and new construction slows.
Property Supply Trends
Completions Remain Far Below Target
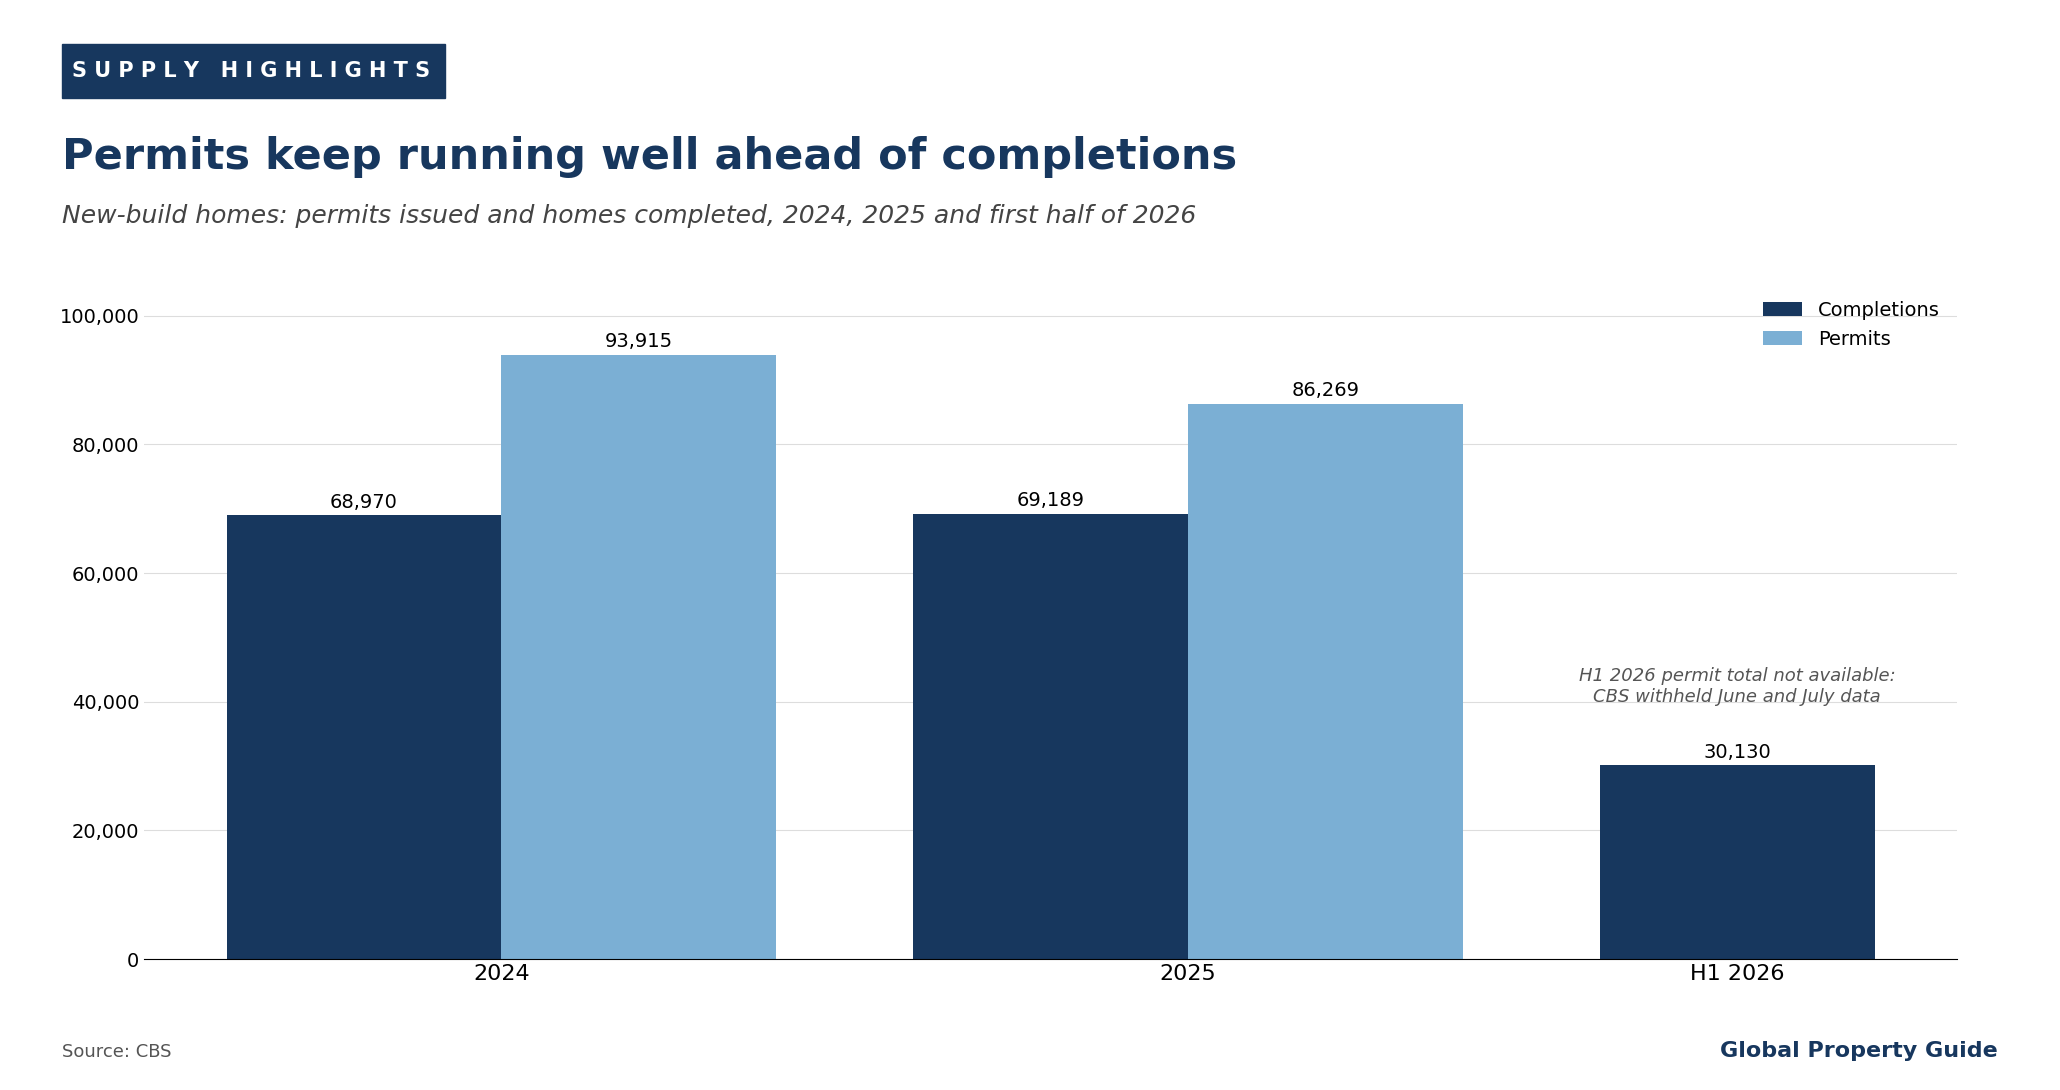
Housing supply remains structurally constrained. According to CBS, 69,189 newly built homes were completed in 2025, broadly unchanged from 68,970 in 2024 and well below the government's annual target of 100,000. In Q1 2026, 13,700 homes were completed, around 1,800 fewer than a year earlier, followed by 16,430 in Q2 2026, according to CBS figures reported by Binnenlands Bestuur. That brings first-half completions to around 30,130.
The Ministry of Housing and Spatial Planning estimated the statistical housing shortage at 396,000 homes in 2025, equivalent to 4.8% of the housing stock.
A Permit Rush Ahead of Grid Rules
Permit data have become harder to read. Permits were issued for 23,500 new-build homes in Q1 2026, 4,700 more than a year earlier. In April and May, municipalities then permitted 8,500 and 10,800 homes respectively, well above the four-year monthly average of 7,100. CBS links the jump to a new prioritisation framework from the competition authority ACM: since 1 July 2026, new homes in grid-congested areas are no longer automatically connected to the electricity network, so municipalities appear to have rushed permits through beforehand. CBS has withheld permit figures for June and July, citing doubts about data quality.
At the end of May, around 234,000 homes had been permitted but not yet built. Rabobank expects completions to exceed 2025's level this year but to decline after 2026, citing grid congestion, rising construction costs and falling new-build sales, which were 12% lower in the first four months of 2026 than a year earlier.
Rental Market: Rents and Rental Yields
Regulated Increases Slow
In the highly regulated Dutch rental market, caps on starting rents and annual increases are set through a point-based system. The Affordable Rent Act of mid-2024 extended regulation to a new mid-market tier, prompting many smaller landlords to sell.
The Netherlands rent price index:
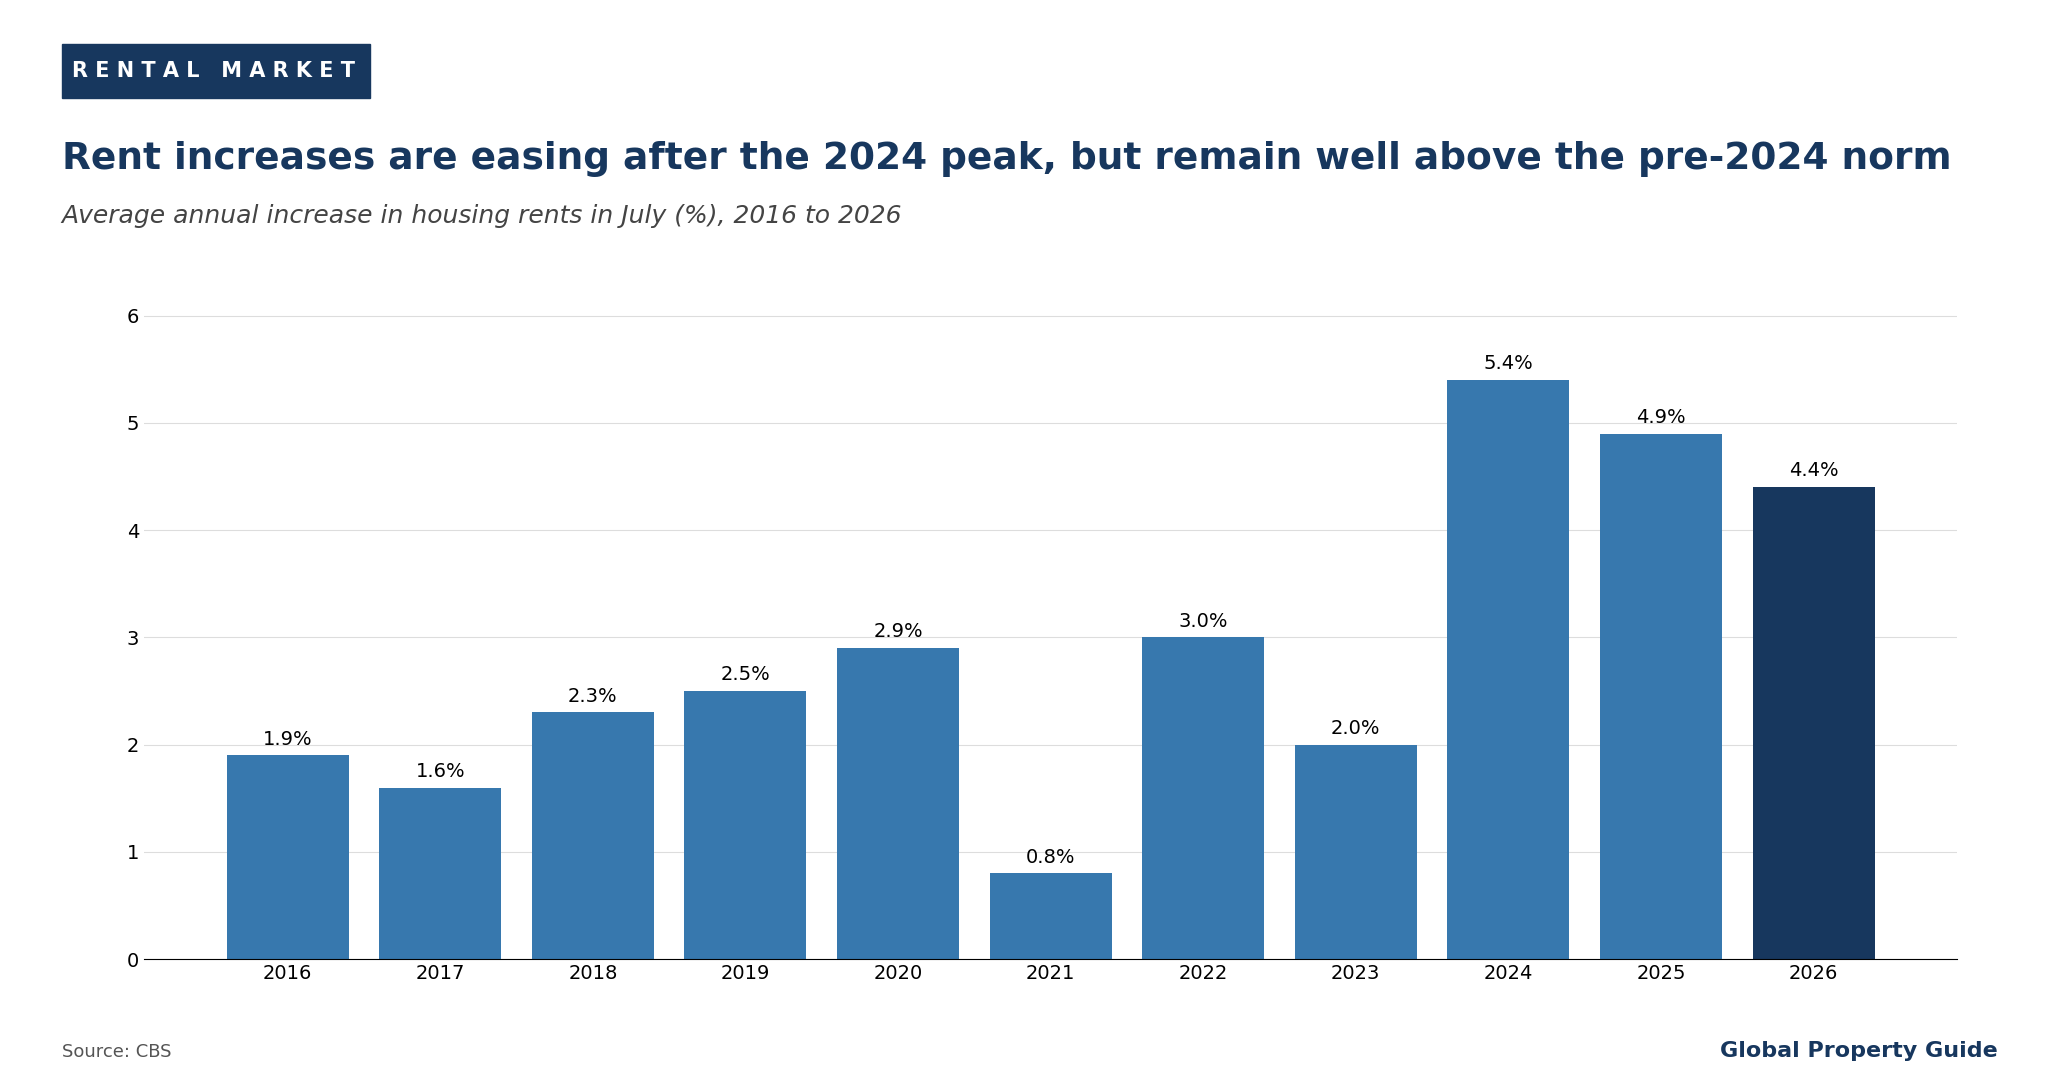
According to CBS, housing rents in July 2026 were on average 4.4% higher than a year earlier, a smaller rise than in the previous two years (4.9% in 2025 and 5.4% in 2024). Excluding tenant changes, rents on existing contracts rose by 3.8%.
Private Rents Pause, Yields Edge Down
The private sector continues to shrink. According to Pararius, as reported by NL Times, new tenants paid an average of EUR 20.94 (USD 24.35) per square meter in Q2 2026, around 5% more than a year earlier but slightly less than in Q1, the first quarter-on-quarter decline in over two years. The average new-contract rent reached EUR 1,882 (USD 2,189) per month. In the quarter, 11,389 homes came onto the private rental market while 12,150 were let or sold, leaving 761 fewer homes available. Pararius reports that the sell-off is increasingly shifting toward the higher-priced segment.
Research conducted by Global Property Guide in Q1 2026 found gross rental yields averaging 6.28%, down from 6.38% in Q3 2025. Rotterdam offered the highest yields (6.91%), followed by The Hague (6.57%), while Amsterdam was lowest at 5.35%.
Mortgage Market and Interest Rates
The ECB Reverses Course
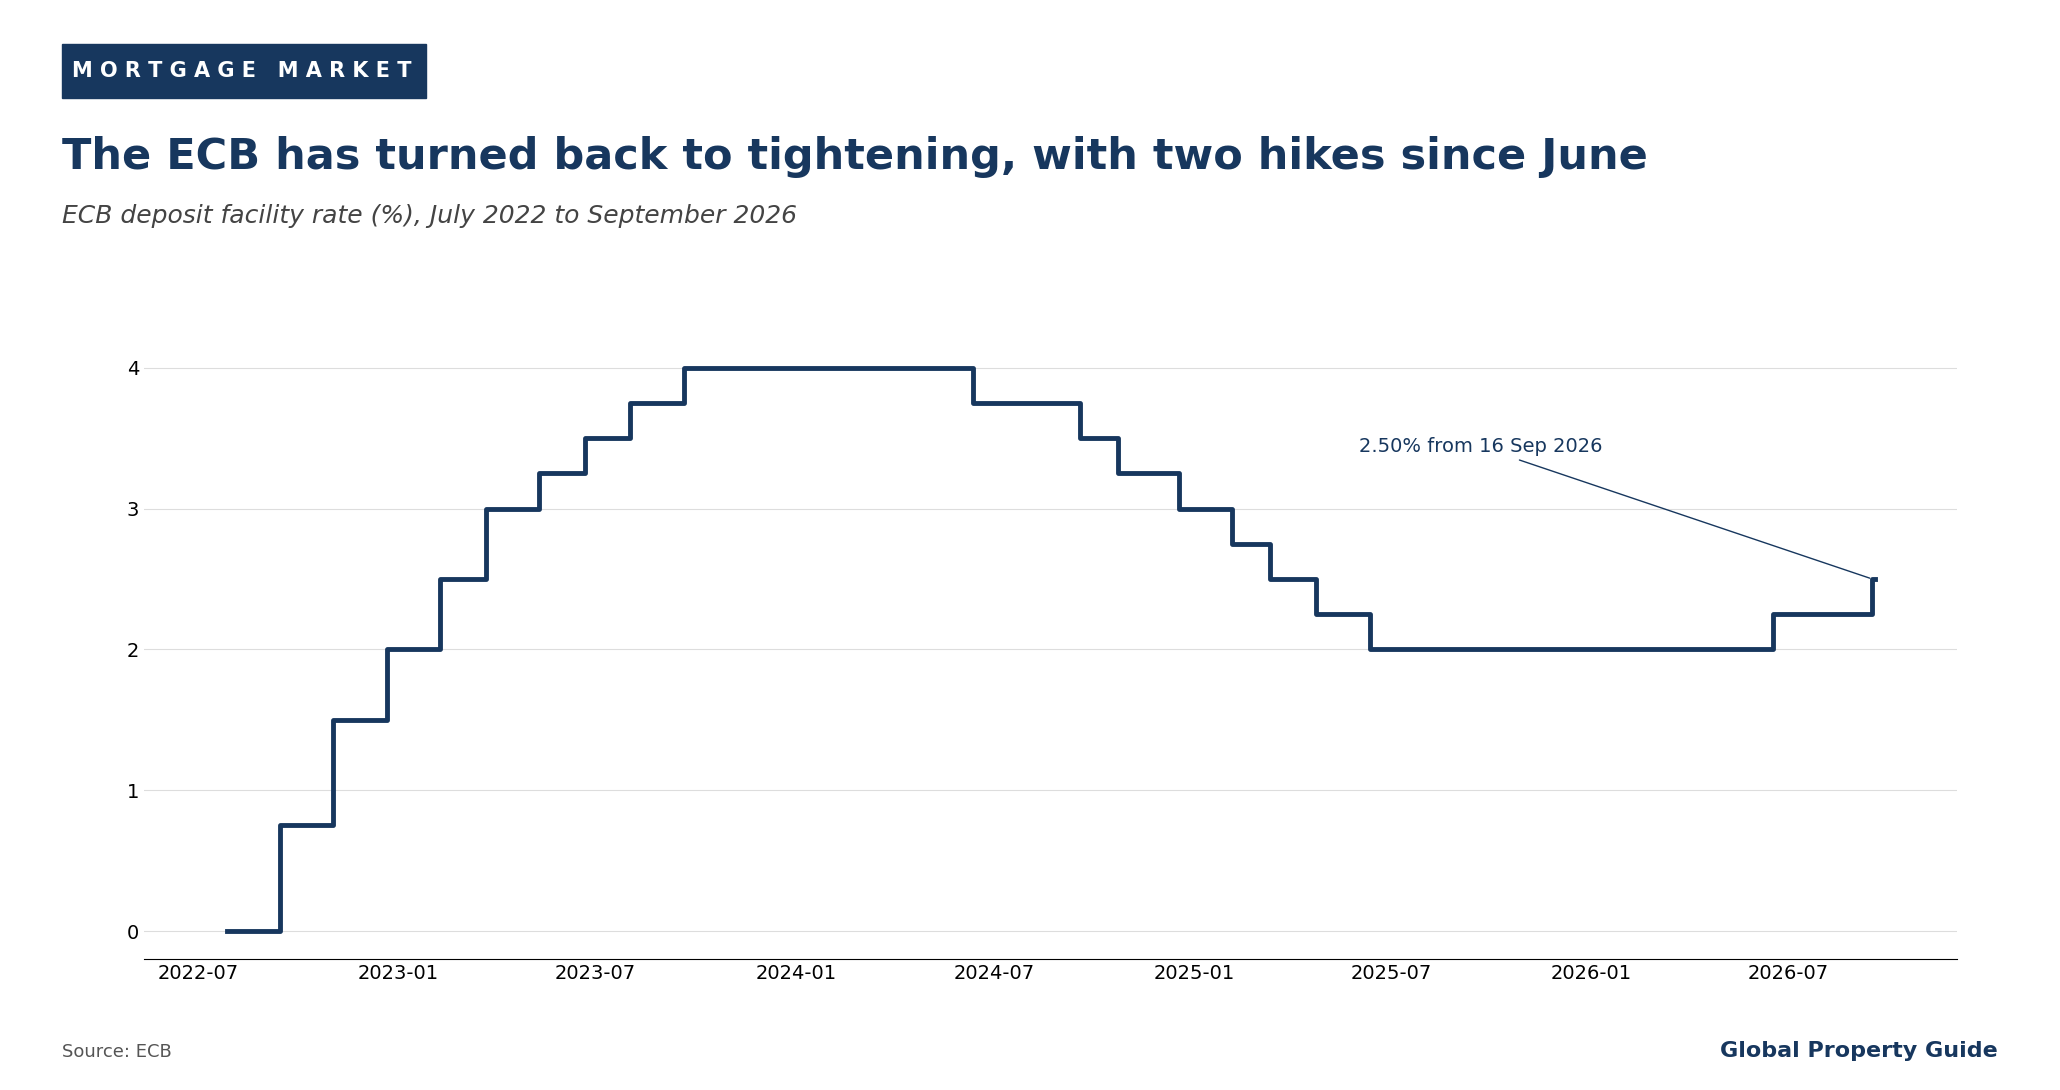
The most important change since our May edition is monetary policy. After holding rates for a year, the ECB raised its key rates by 25 basis points in June 2026, the first hike in almost three years, as the Middle East conflict pushed up energy prices and inflation. It paused in July and hiked again on 10 September, taking the deposit facility rate to 2.50% from 16 September 2026.
Mortgage Costs, Demand and Credit
Capital market rates, the main driver of Dutch fixed mortgage rates, have also risen: Rabobank noted in June that the 10-year swap rate was about 30 basis points higher than at the end of February and expects a further rise of more than 20 basis points by year-end. ABN AMRO expects short-fixed mortgage rates to edge up further, with long-term rates broadly stable.
The Netherlands mortgage loan interest rates:
Higher rates have cooled mortgage demand. The Hypotheken Data Netwerk (HDN) registered 40,692 mortgage applications in April 2026, down from 45,017 a year earlier, with first-time buyers accounting for most of the decline. In May, applications were 3% lower year-on-year, while the average value of homes being financed reached a record EUR 535,500 (USD 622,733), with little change in average loan size, indicating that buyers are putting in more of their own funds.
The total value of outstanding housing loans reached EUR 890.2 billion (USD 1.04 trillion) at the end of 2025, up 4.6% year-on-year, as reported by DNB. About 71% was provided by banks and 29% by non-bank institutions such as insurers and pension funds. According to Eurostat figures, 57.9% of the population lives in owner-occupied homes with an outstanding mortgage or housing loan.
Economic and Social Factors
Growth Holds Up, Inflation Returns
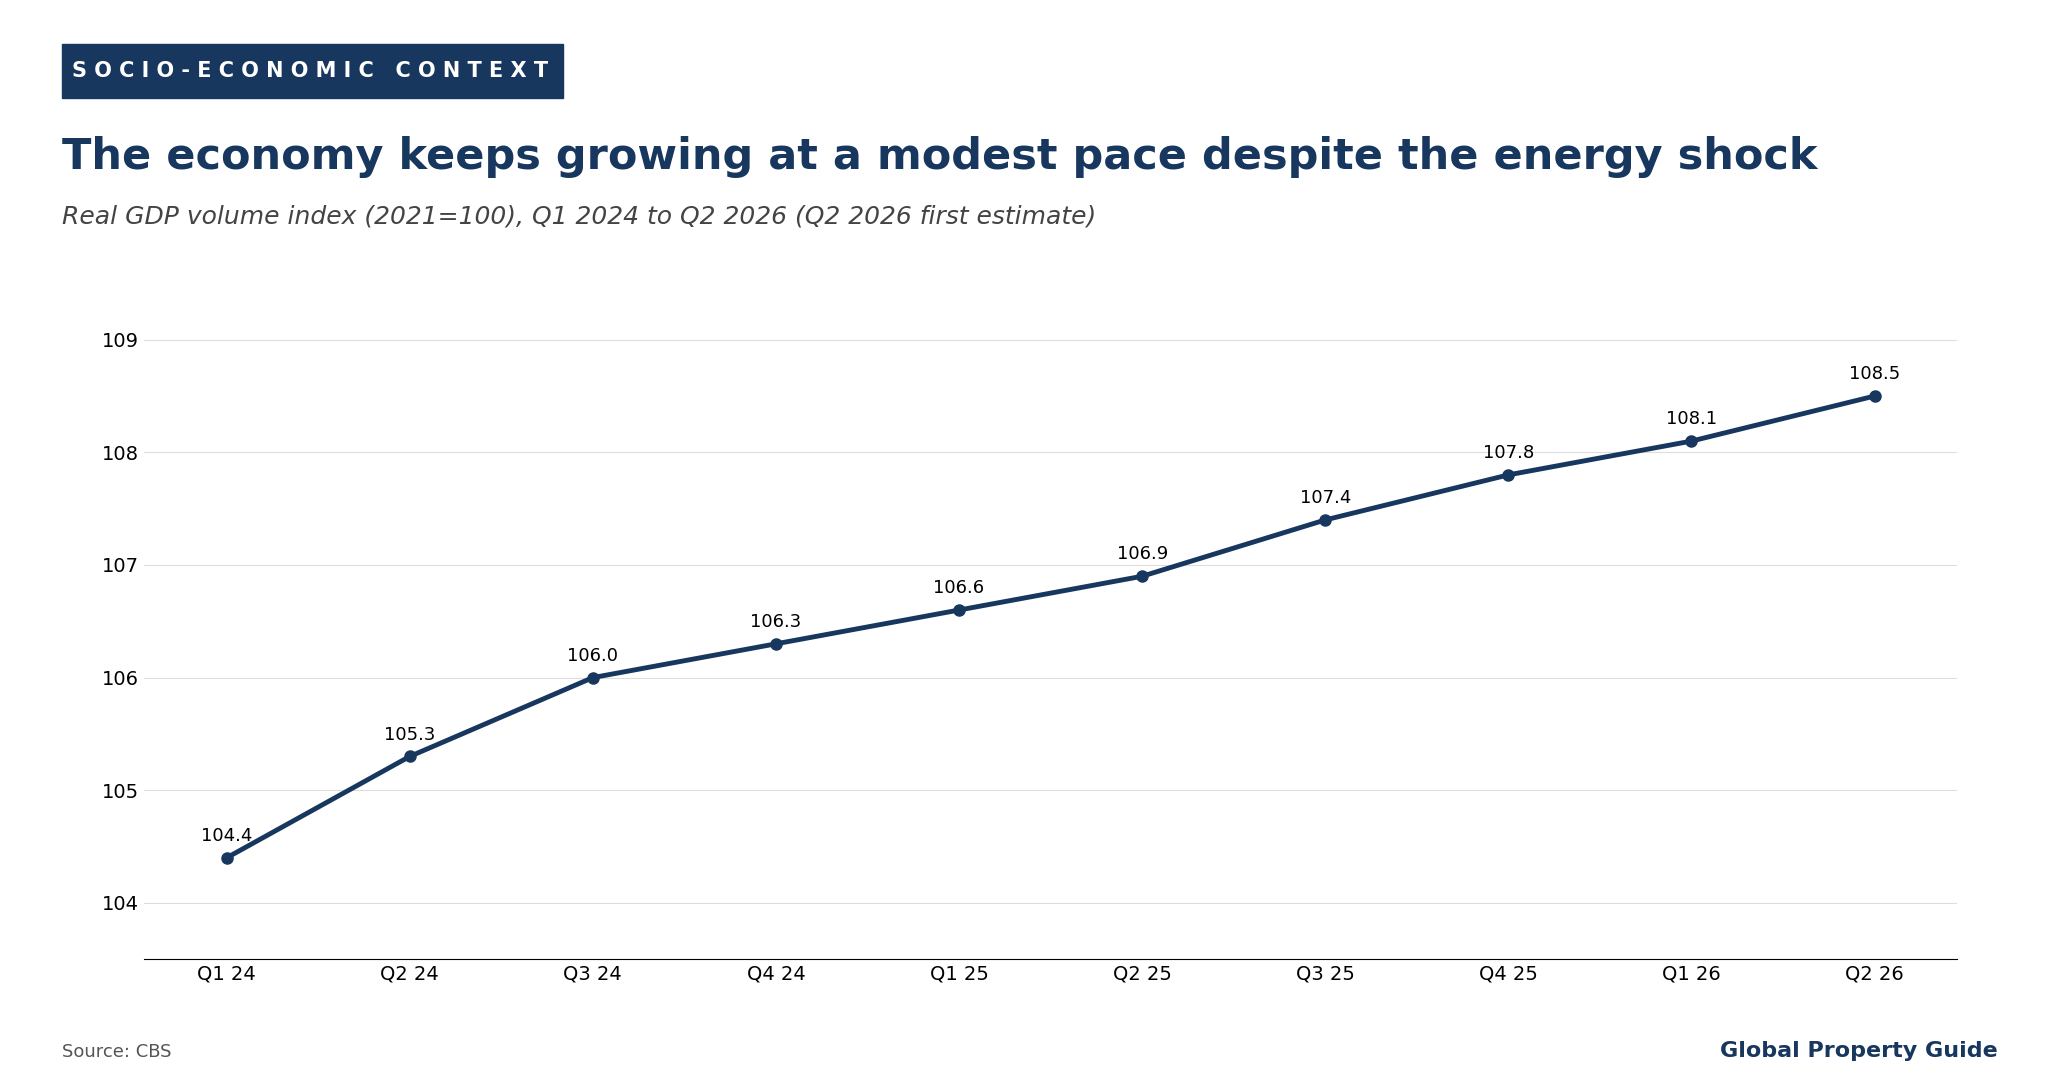
The Dutch economy has so far absorbed the energy shock. GDP grew by 0.4% quarter-on-quarter in Q2 2026, according to the first CBS estimate, after 0.3% in Q1, with household and public consumption the main contributors. For 2026 as a whole, DNB projects growth of 0.8%, rising to 1.2% in 2027 and 1.3% in 2028, and expects the budget deficit to exceed 3% of GDP this year.
Consumer price inflation rose to 3.3% in August 2026, from 2.4% at the start of the year, driven by energy prices. On the harmonised European measure, inflation was 2.8%. DNB projects HICP inflation of 2.7% for 2026, down from 3.0% in 2025 but above its previous forecast.
Labour Market and Politics
Unemployment is creeping up. In August 2026, 408,000 people were unemployed, an unemployment rate of 4.0%, and the number of people in work has hovered around 9.8 million for almost three years. Wage growth remains strong, however: Rabobank expects collectively agreed wages to rise by 4.3% in 2026 and 4.0% in 2027, which continues to support borrowing capacity.
The Netherlands retains its 'AAA' rating with a stable outlook, affirmed by Fitch Ratings in January 2026. Politically, however, the country is on uncertain ground. The Jetten I cabinet of D66, VVD and CDA, sworn in in February 2026, is a minority government without a majority in either chamber of parliament and depends on opposition support to pass legislation. It presented its first budget on 15 September 2026 without a guaranteed majority, and housing construction remains one of its stated priorities.
Sources:
- Statistics Netherlands (CBS)
- House Prices up by Nearly 4 Percent in July, Year on Year: cbs.nl
- Existing Own Homes; Purchase Prices, Price Index 2020=100, Region: cbs.nl
- Prices of Existing Owner-Occupied Homes Fell in 6 Municipalities (NL): cbs.nl
- Existing Owner-Occupied Homes Over 5 Percent More Expensive in First Quarter (NL): cbs.nl
- Growth of Housing Stock Slows for Third Year in a Row: cbs.nl
- More Permitted New-Build Homes in First Quarter (NL): cbs.nl
- Construction Turnover Up in Second Quarter (NL): cbs.nl
- Housing Rents up by 4.4 Percent on Average (NL): cbs.nl
- Dutch Economy Grew by 0.4 Percent in Q2 2026: cbs.nl
- Inflation Increases to 3.3 Percent in August: cbs.nl
- Unemployment up Slightly in August: cbs.nl
- Land Registry (Kadaster)
- Housing Market Q2 2026 (NL): kadaster.nl
- De Nederlandsche Bank (DNB)
- European Central Bank (ECB)
- Key ECB Interest Rates: ecb.europa.eu
- Monetary Policy Decisions, 23 July 2026: ecb.europa.eu
- Euro Foreign Exchange Reference Rates: ecb.europa.eu
- Ministry of Housing and Spatial Planning
- The Statistical Housing Shortage Explained (NL): volkshuisvestingnederland.nl
- Eurostat
- Distribution of Population by Tenure Status, Type of Household and Income Group: ec.europa.eu
- Rabobank
- Dutch Housing Market Quarterly: End of the Price Rally, Housing Market Cools Down: rabobank.com
- Housing Market Quarterly: House Prices Will Rise Slightly This Year: rabobank.com
- ABN AMRO
- Mortgage Rate Outlook (NL): abnamro.nl
- Monitor Koopwoningmarkt
- Quarterly Report Q2 2026 (NL): monitor-koopwoningmarkt.nl
- NVM
- Housing Market Analysis Q2 2026 (NL): nvm.nl
- De Hypotheker
- HDN: Number of Mortgage Applications Fell Sharply (NL): hypotheker.nl
- HDN Registers Slightly Fewer Mortgage Applications (NL): hypotheker.nl
- Binnenlands Bestuur
- Growth in Building Permits Due to New Grid Priorities (NL): binnenlandsbestuur.nl
- NL Times
- Private Sector Rent Hikes Outpace Inflation as Landlord Sell-Off Continues: nltimes.nl
- Jetten Cabinet Starts Meeting with Opposition Parties: nltimes.nl
- Fitch Ratings
- Fitch Affirms the Netherlands at 'AAA'; Outlook Stable: fitchratings.com
- Global Property Guide
- Netherlands Rental Yields: globalpropertyguide.com